Machine Learning algorithms are different from standard algorithms in that at the time of development that output of the algorithm is known. Machine Learning algorithms adapt and evolve over time based on their observations of their environment giving them the appearance of learning. Much of the basis for the design and implementation of the algorithms revolves around statistical probabilities and random numbers.
At its core, Machine Learning algorithms take an input and produce an output based on statistical probabilities that have been learned over time. Let us take an example in the form of a linear function
f(x) =(w*x)^2 + ( y*x) + z
In this example, let us assume that our desired output is achieved when w is set to 6, y is set to 3, and z is set to 4. Before continuing we need to introduce the concept of Error Calculations, which are just a measure of how well the algorithm performed compared to the ideal output represented as a numerical value. In this example the smaller the error the better the algorithm performs. There are many methods to calculate this, but are beyond the scope of this page.
Now if we randomly set the values for w, y, and z we can test to see how well the algorithm performs compared to the ideal output. The values for w, y, and z can be adjusted to produce the smallest error (see Error Calculation for more details). This is at its core the process of learning that the machine will utilize to produce an algorithm that is as close to ideal as possible.
A Greedy Algorithm can be used to train this problem. This algorithm selects random values for w, y, and z and calculates the error. If the error produced is the smallest error seen during execution these values are saved. This process repeats for a set number of iterations or until the error has reached an acceptable level. A sample execution of this algorithm is shown below. You can see that as the number of iterations progresses, the error becomes smaller and smaller.
New Best found at iteration 3 with value of: 548006223.947552
New Best found at iteration 20 with value of: 4994319.321887
New Best found at iteration 1706 with value of: 628623.340930
New Best found at iteration 11554 with value of: 408410.356152
New Best found at iteration 30336 with value of: 183759.690132
New Best found at iteration 203935 with value of: 125141.168380
New Best found at iteration 475457 with value of: 45782.053059
New Best found at iteration 905047 with value of: 42609.872148
Best:
[19.221771778497, 2.6541857892054876, 4.005034917078298]
42609.8721484
Ideal:
[6, 3, 4]
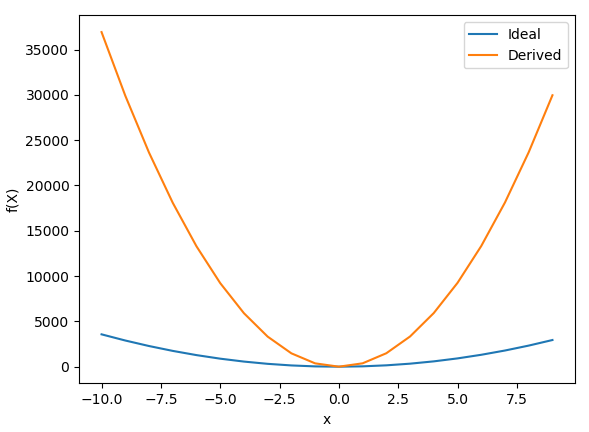
We can see that the algorithm was able to get fairly close to the y and z values through random guessing but was unable to get the proper w value. The following figure shows the output graph from this sample execution.